


How to Build a Beauty Brand Dashboard That Actually Tells You What's Working

There's no shortage of data in DTC beauty. Meta Ads Manager shows you 47 metrics. Klaviyo shows you open rates, click rates, revenue per recipient. Shopify shows you sessions, conversion rate, AOV. TikTok shows you video views, engagement rate, CPC. Google Analytics shows you everything. And most beauty founders look at all of it, understand none of it well, and end up making decisions based on whichever metric happened to be on their screen when they needed to decide something. Drowning in data and starving for insight is the most common analytics failure in DTC beauty.
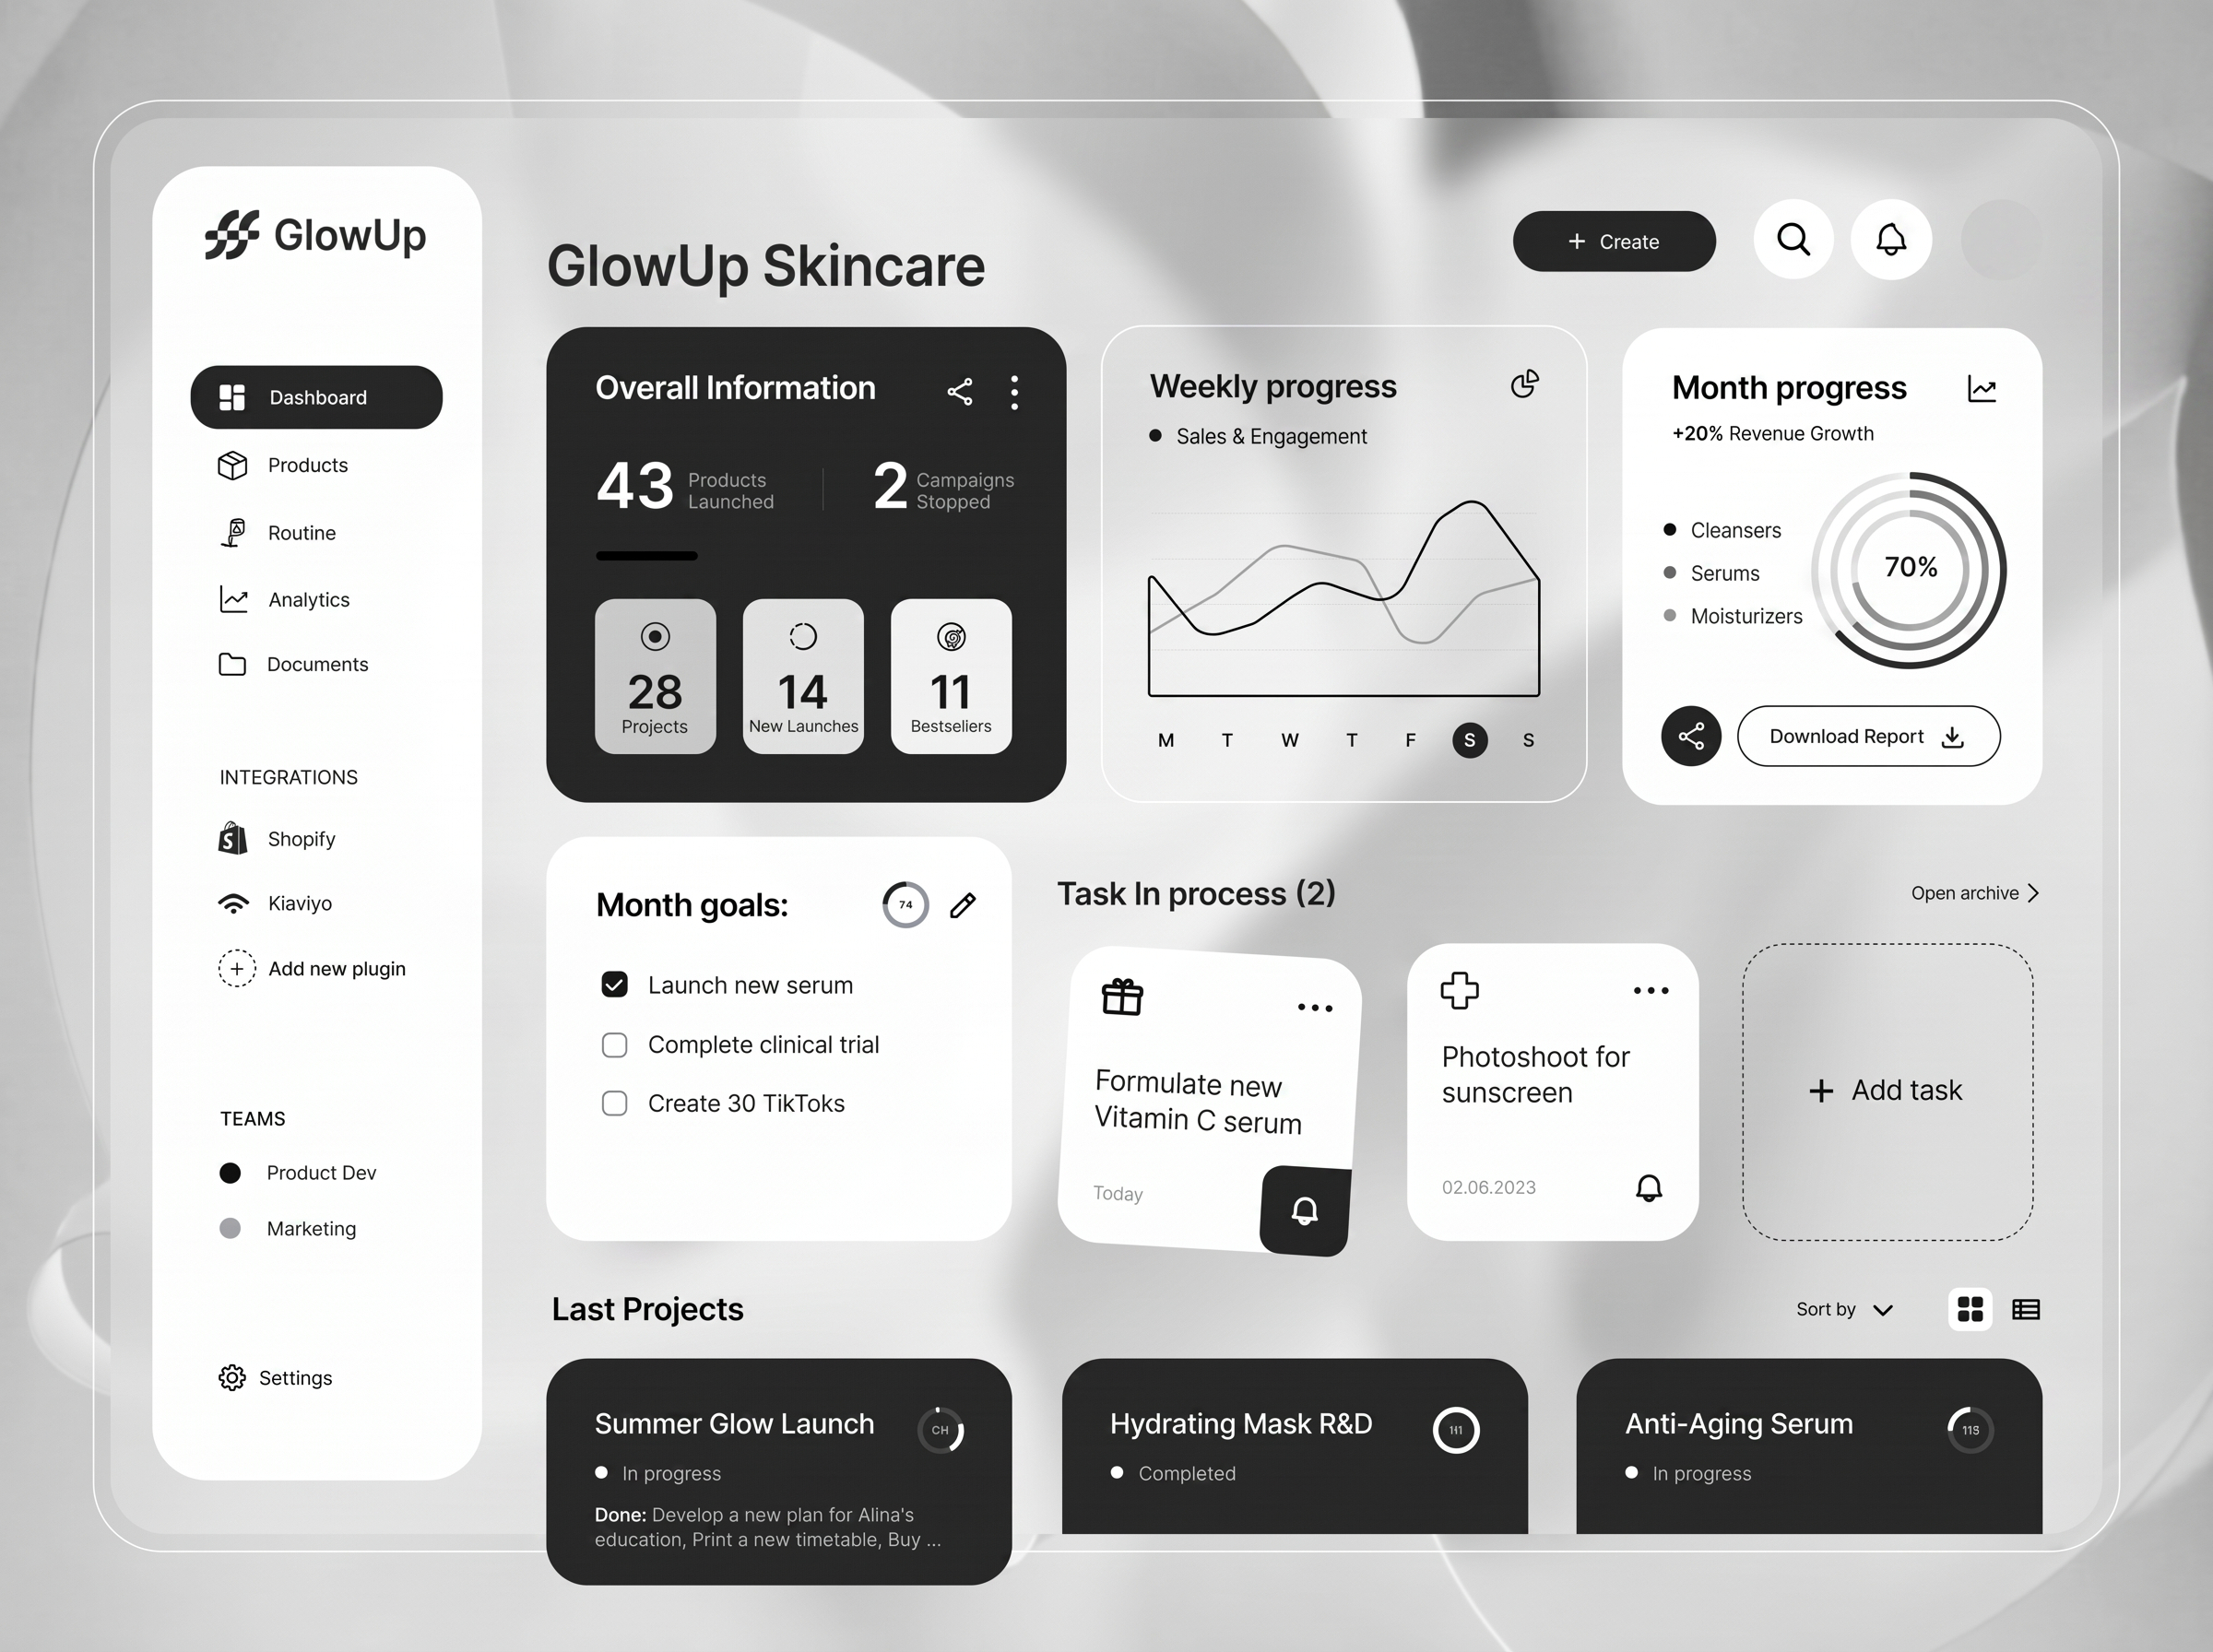
The fix isn't more dashboards or better tools. It's fewer numbers, chosen deliberately, tracked consistently, and reviewed at the right cadence. A good beauty brand marketing dashboard has 8–12 metrics maximum, organized into three levels: daily operational metrics, weekly performance metrics, and monthly strategic metrics. Here's exactly how to build it.
The Problem: Vanity Metrics Crowd Out Decision-Making Metrics
Most beauty brand founders spend too much time looking at vanity metrics — impressions, followers, likes, video views — and not enough time on the metrics that predict business outcomes. Impressions don't pay for inventory. Followers don't fund operations. A decision-making metric is one that, when it changes, tells you to do something different. A vanity metric tells you how things look. The goal of a dashboard is decision support, not monitoring.
The second problem is metrics without context. Knowing your email open rate is 28% tells you nothing without knowing whether that's trending up or down, how it compares to your category benchmark, and whether it's correlated with revenue. Every metric on your dashboard needs a benchmark and a trend line — otherwise it's just a number.
The Three-Level Dashboard Structure
Daily metrics are leading indicators that tell you whether today is tracking on plan. You should be able to review these in under 5 minutes. Weekly metrics are performance indicators that tell you whether your programs are working. Monthly metrics are strategic indicators that tell you whether your business is healthy and moving in the right direction.
The 10 Metrics Your Beauty Brand Dashboard Needs
1. Daily Ad Spend vs. Budget (All Channels): Are you spending what you planned? Overspend or underspend by more than 15% signals a technical issue or budget pacing problem. This is a daily operational check, not a performance check. Check it every morning.
2. Daily Revenue vs. Forecast: Is today tracking to your daily revenue target? This is your most important early warning signal. Daily revenue tracking with a rolling 7-day average lets you identify problems (or opportunities) within days rather than at month-end when it's too late to course-correct.
3. Weekly Blended ROAS: Total revenue divided by total marketing spend for the week. This is your top-level efficiency metric for paid acquisition. Benchmark against your target (typically 2.5–3.5x for DTC beauty depending on margins) and track the trend. A declining blended ROAS week-over-week is the first signal that creative is fatiguing or CAC is rising.
4. Weekly Email Revenue Share: What percentage of your total revenue came from email and SMS this week? Below 20% indicates an underperforming retention program. Above 35% indicates strong retention infrastructure. This metric directly reflects the health of your Klaviyo flows and campaign program. A rising email revenue share means your retention investment is compounding — one of the clearest signals of long-term business health in DTC beauty.
5. Weekly New vs. Returning Customer Ratio: What percentage of this week's orders came from new customers vs. repeat customers? For healthy DTC brands, 40–50% returning customer rate is a strong signal. Below 20% means your retention is failing. Above 70% means your acquisition is stalling. This ratio tells you whether your business is balanced between acquisition and retention — the two engines of sustainable DTC growth.
6. Monthly CAC by Channel: What did it cost to acquire a new customer through each channel this month? Track Meta, TikTok, Google, email/referral, and organic separately. This data tells you where you're getting efficient and inefficient, and drives your monthly budget allocation decisions. CAC by channel tracked monthly reveals trends that weekly ROAS doesn't capture — particularly gradual audience saturation on a single channel.
7. Monthly LTV30 / LTV90 / LTV12: Track the average revenue generated by customers acquired 30 days ago, 90 days ago, and 12 months ago. LTV progression tells you whether your retention programs are working over time. A flat LTV30 to LTV90 means customers aren't coming back after their first purchase. A strong LTV90 to LTV12 progression means your retention programs are successfully extending customer relationships.
8. Monthly Repeat Purchase Rate: Of customers who made their first purchase 90+ days ago, what percentage have made a second purchase? This is your single most important retention metric. The DTC beauty benchmark for healthy repeat purchase rate is 30–40% at 90 days. Below 20% means significant retention infrastructure is missing. Above 45% means exceptional retention performance.
9. Monthly Conversion Rate by Traffic Source: Break your site conversion rate by source: paid social, organic search, email, direct. These numbers move differently for different reasons. Your email traffic should convert at 5–8%. Your organic search traffic should convert at 2–4%. Your paid social traffic should convert at 1.5–3%. Knowing each source's conversion rate tells you where your optimization efforts have the most impact.
10. Monthly Contribution Margin: Revenue minus all variable costs (COGS, shipping, payment processing, variable marketing). Track this monthly against a target (35–45% for DTC beauty). A declining contribution margin is the most serious strategic signal on the dashboard — it means your costs are rising faster than your revenue, which is unsustainable regardless of growth rate.
What to Build First
Start with a simple Google Sheet with these 10 metrics, updated weekly. You don't need Triple Whale or Northbeam or a custom BI tool to start — you need the discipline to track the right numbers consistently. Add tooling once you've built the habit of reading and acting on the data.
At Veilup, we help cosmetics and skincare brands build marketing analytics infrastructure — from dashboard design and data integration to performance review processes and strategic interpretation. If your brand needs clarity on what's actually working, the framework to get it is already here.
More insights